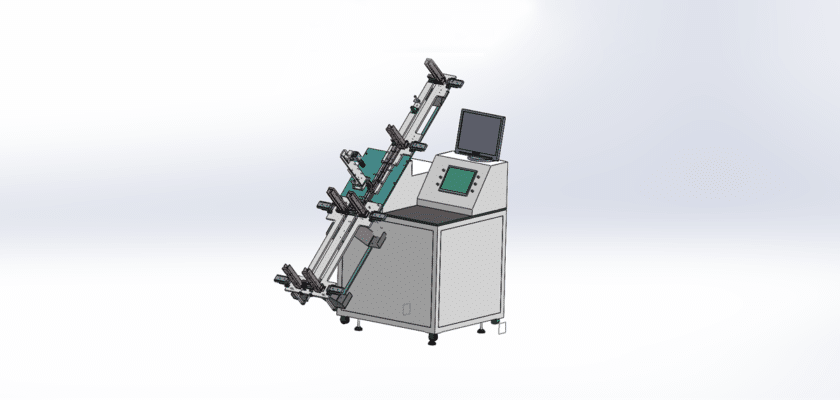
Un Dessin automatique du système visuel is a type of automated graphic representation that visually conveys the structure and dynamics of a system. This drawing is generated using software tools that interpret data inputs and create diagrams that highlight relationships, processes, and components within the system.
Caractéristiques principales :
- Composants: Visual elements like boxes or circles representing different parts of the system (e.g., machines, processes, users).
- Connections: Lines or arrows that illustrate how these components interact or flow into one another, indicating relationships or data pathways.
- Annotations: Text labels that provide additional context, such as names, functions, or statuses of the components.
- Dynamic Elements: Some systems may include animated or interactive features, allowing users to explore different scenarios or states.
These drawings are particularly useful in fields such as engineering, IT, and business analysis, as they simplify complex information, making it easier to understand and communicate system functionality and design.
